↓National Weather Service↓
Lower Saddle Forecast for 11,600ft
(summer only)
SOMETIMES HAS OPERATIONAL ISSUES
The National Weather Service's Lower Saddle Forecast is updated throughout the day. Its hourly forecast is our starting point before every climb. We like to check their Forecast Discussion for Western WY and sometimes Eastern Idaho. We have yet to find a better forecast for the Grand. We have seen them all. We favor it for analyzing unstable weather. Like any forecast, there's a lot of wiggle room when it comes to accuracy. The more you use any forecast source, the more you'll figure out its typical errors. For example, wind speeds at the Lower Saddle tend to be off by a factor of 2 or more (should be higher) than what's in the forecast because the topography isn't taken into account. Reading the Forecast Discussion might help you understand the decision-making process for the forecast and possible red flags (they sometimes point out when their forecast models don't agree).
Of course, there are many great weather apps and websites which pull data from the NWS so they should work equally well for a forecast. Additionally, checking more than one forecast (& forecast model) is common and recommended for climbers. Different forecast models are available from many sources including the NWS & Windy. Also, the forecast from any source might not be the newest forecast so check more than one!
Summer rain can turn to ice at any time of year so keep an eye
on temps up high and recent precipitation when planning a trip. It can take several days for water to completely drain off the mountain after a big storm. That means ice can develop long after a storm has passed. Ice can also form from passing clouds or mist and cold temps. You should also keep tabs on valley webcams for localized weather events....
The NWS said this about their forecast model for the Tetons back around 2011 when they provided a forecast for the Grand Teton: "the resolution of the forecast database is not fine enough for some weather elements to capture the true variation in weather around GTNP. Most of these sites do not have automated observation platforms with which to compare, so further collaboration will be needed to provide better forecasts for GTNP employees and visitors. Subjective evaluation of the model output suggests that higher resolution nesting, perhaps down to 1- or 2-km resolution, might be required to better capture the critical weather variables around the steep and narrow terrain of western Wyoming."
The Saddle's seasonal weather station sometimes goes offline during the summer. It may be back up and running within a day or two, or take much longer to fix. In 2025, it was offline for the entire climbing season.
When MesoWest servers are down, we are unable to pull up the Lower Saddle weather data displayed here. You can check the NWS weather station map or the Synoptic weather station map for the Lower Saddle's current weather data if the MesoWest data is unavailable. The data flowing into MesoWest systems now originates entirely from Synoptic per a Spring 2025 announcement.
~ SUMMER ONLY ~
Lower Saddle Wind Speeds
~ SUMMER ONLY ~
Again, forecast wind speeds for the Lower Saddle are often off by a factor of 2 or more because the forecast doesn't take into account the topography of the saddle (wind speeds should be higher).
Keep an eye on rainfall totals in the hourly forecast. If the forecast shows a 60% chance of rain but only .01" of rain is expected, then you can assume that a massive storm is not on the horizon. We often go climbing even though the odds are favoring a short shower. Sometimes, that short shower is miles away from the Grand. And a 70% chance of bad weather may never materialize while a 20% chance of bad weather does. This is especially true in the Tetons.
Many of the weather links are best viewed on a large screen, not a phone.

 Check Time

 Updated every 15 min. or so. Check time
 Current Wind Obs Near 9800 ft (700mb)

Wind Barb Information


 Precipitation Data @ Jackson Hole Airport
 U.S. CRN, Moose, WY
 NOAA's dBZ color coding
 Forecast Jet Stream 300mbars (near 30,000 ft)
Take all of these forecast maps with some healthy skepticism. 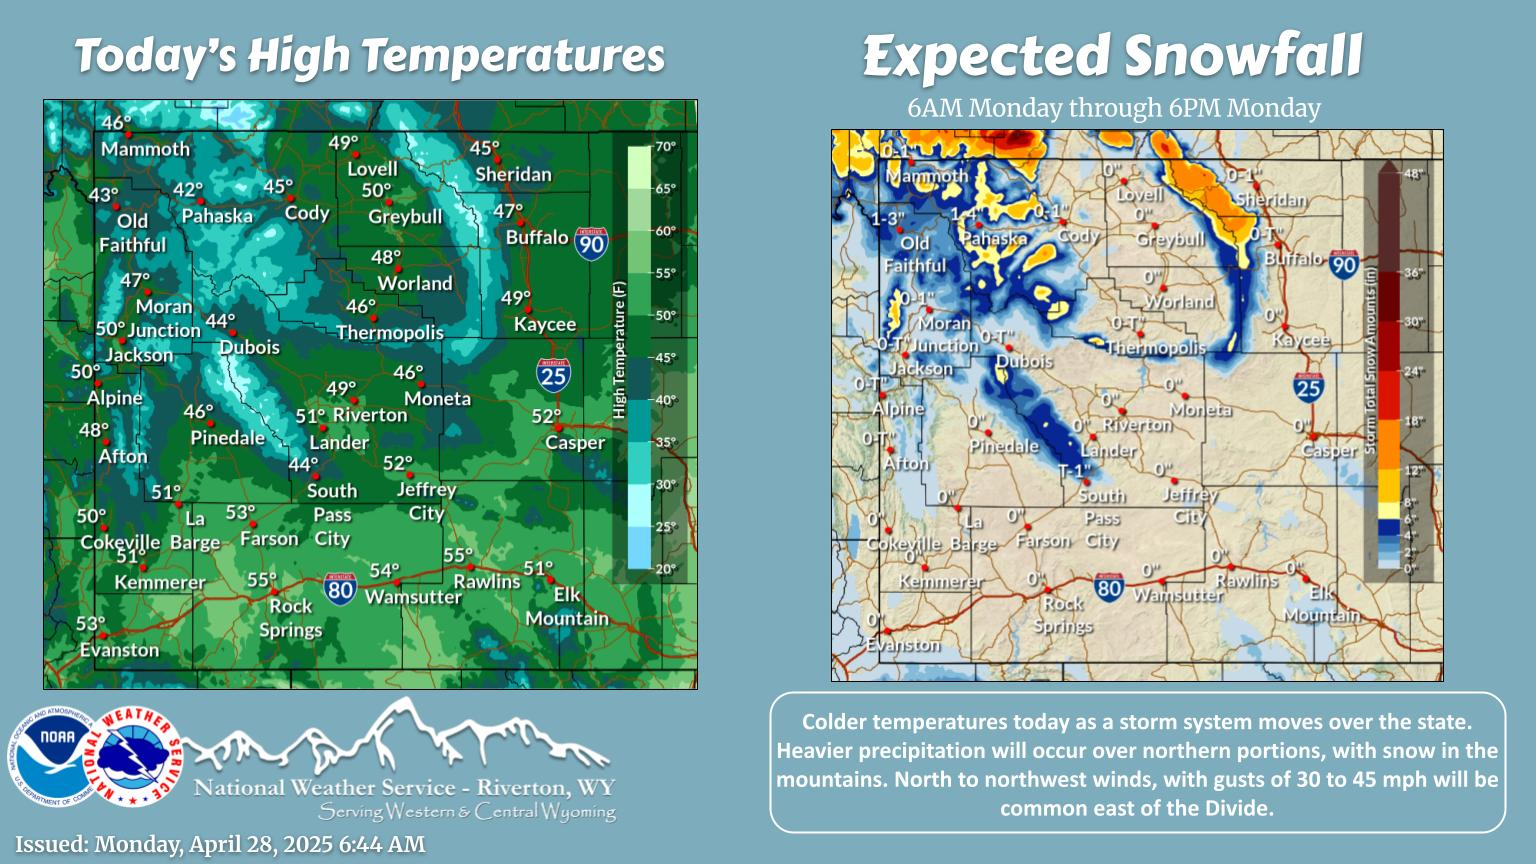
 12-Hour Forecast - See 'valid' time (ex: 0000 UTC Monday is 6 p.m. Sunday)


There are no safe places if you are outside in a thunderstorm. What follows is some general advice...

 Lower Saddle Temperatures Summer 2015 -11,600'

 Lower Saddle Temperatures 2018 - 11,600'

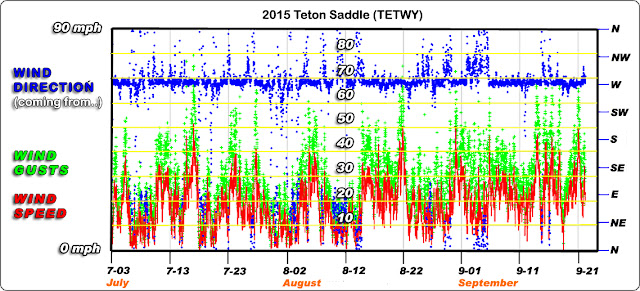 Lower Saddle Wind Speeds Summer 2015 - 11,600'


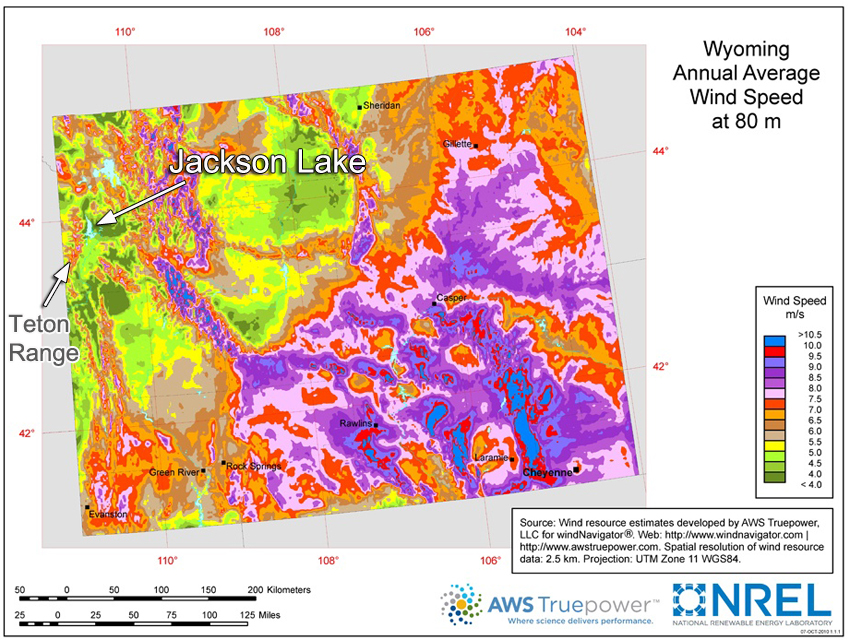 Unlike much of Wyoming, Jackson Hole's valley floor is not known for high wind speeds.

GTNP Weather Line: 307.739.3611


 Inversion Temperatures: Saddle (11,600ft) vs. Airport (6450ft)
As the graphic above clearly illustrates, the time of day can influence the temperature difference between two different elevations. And temperature swings at the Lower Saddle are fairly minor compared to those at the valley floor during the summer.
Snow
or hail can form 1000' ft above the mountain and accumulate
on the ground even though temps on the mountain are above freezing.
Lastly, just as adding salt to water can lower its freezing point, the opposite can happen by adding a tiny amount of insoluble particulates to water. That can actually help water freeze at a higher temperature.


Atmospheric pressure changes with the weather so these are estimates based upon a set of parameters that may not reflect actual elevations and pressures in your area.
 Typical Equinox & Summer Solstice sun positions
 Position of the Sun in the sky at 43° N
 Cody Bowl JHMR
JHMR Weather & Snow Report
JHMR Grooming Map
JHMR Summer Trail Map
Snow King Snow Report
Targhee Snow Report
JH P&R XC Grooming Report
JH Nordic Skiing
JH Ski Club
JH Snow Devils
TetonAT.com
JH P&R Ice Rinks
Snow King Ice Rink
Powder Project
Backcountry Recon
Friends of Pathways Nordic & Pathway Maps
Snowmobile Maps
JH Ski Atlas
JH BC Skiing Books
Overview - Upper Exum
Overview - Owen-Spalding
The Approach to the Lower Saddle
Wyoming Whiskey Home Page
Enjoy Safe Climbing
~~~~~~~~~~~
** Current Snow Cover **
SpotWx for 10K feet By Grand
A
Teton forecast is good for about 6 hours. An
accurate forecast during periods of moderate instability is extremely
difficult to nail down with certainty. You can have more faith in a forecast
if a stable high pressure system sits over the Northern Rockies and we're in its center. Either way, it's still important to read the weather as you travel. Highly localized mountain
thunderstorms are often omitted from a morning forecast.
Keep in mind that all forecast temperatures are temperatures of the air in the shade. It can feel much hotter in direct sunlight. The wind chill may negate any feelings of additional warmth, however.
Keep in mind that all forecast temperatures are temperatures of the air in the shade. It can feel much hotter in direct sunlight. The wind chill may negate any feelings of additional warmth, however.
The Lower Saddle's weather station allows you to keep tabs on weather
conditions and it can help you predict climbing conditions. Unfortunately, it doesn't collect
rainfall information. It does have Dew Point data which can help predict precip. The weather station at the Jackson Hole Airport and the station at the Driggs-Reed Memorial Airport in Idaho collect rainfall totals on their respective sides of the
Tetons. If it rained at both airports then it's likely to have rained on the Grand. Rainfall data isn't always posted to Mesowest for unknown reasons but their graphics can often bring it up. You may find rainfall data on the NWS website for the airport. And the Synoptic weather map may have rainfall data on both sides of the Tetons.
Rainfall graphs from 4 weather stations are posted further below. Keep in mind that rainfall on
the Grand can bypass the weather stations and vice-versa.
If you are heading out during the winter, be sure to check the BTAC Avalanche Forecast and avalanche resources from the National Weather Service in Riverton, WY. While not definitive on hazards (far from it),
they can give you a good feel for some very real threats. The
avalanche forecast is not for extreme terrain or elevations above 10,500
ft. And keep in mind that many people get caught in avalanches when the threat is moderate. It's a forecast and it knows nothing about the terrain you plan to visit.
You might like to look at the night sky forecast and sunrise & sunset times.
You might like to look at the night sky forecast and sunrise & sunset times.
Usually, image is updated within last 15 min.
Local Radar Pocatello, ID
(best Teton Range coverage)
Local Radar Riverton, WY
(so-so Teton coverage)
(Expected Radar in 20 to 40 minutes)
If you don't see our weather graphics, you might be using the Chrome browser on an Android device that has its Data Saver mode turned on. Additionally,
you might need to clear your browser's cache to see newer data or
refresh the page to see a newer image. Many images have a time stamp in
Zulu or UTC time. Check the CURRENT UTC/Z TIME to see how old the image is. Time.gov is often useful.

Newest animation is here:
Most images are updated every 5 minutes but animation gif's are rarely that new. The image we pull up is usually within 15 min of being captured. The
latest images can be found on the GOES website.
Here's a custom western satellite image of cloud cover along the WY-ID Border as seen from the WEST. Teton County is in the center of the image. Jackson is near the bottom of Teton County. And here's an eastern satellite image of cloud cover along the ID-WY border as seen from the EAST. APIs are available to build your own image from NASA and others.
Keep in mind that it can be
snowing or raining in JH and you may not see evidence of that on the
radar image. And what you see on the radar image may just be 'noise'. You can read more about how to better examine a radar image.
These images are good for checking on summer wildfire smoke. At night, the blue colors represent liquid water clouds
such as fog and stratus, while gray to white indicate higher ice
clouds.
Speed, Gust, Direction from.
The Mt Glory Weather Station is mostly used for the Avalanche Forecast so it might be offline during the summer.
Out of the Univ. of Colorado, the University Corporation for Atmospheric Research manages the National Center for Atmospheric Research on behalf of the National Science Foundation. They provide a nice collection of Real-Time Radar, Models, Forecasts, etc. We sometimes use it for examining the Pocatello (KSFX) Radar's Base Velocity images which aren't always easy to find elsewhere.
Wind speeds are usually modeled for places outside of the observation area. They may not reflect the localized wind speeds you experience.

Wind Barb Information
(outdated quickly in the Tetons)
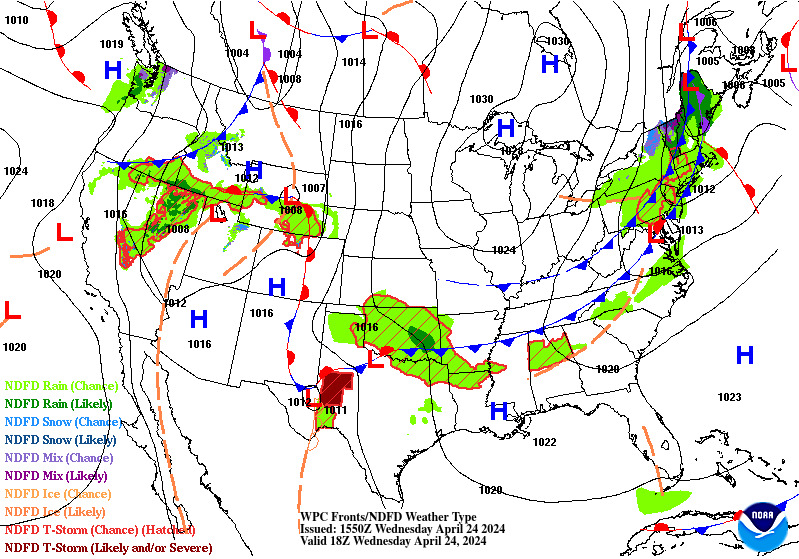
The above graphic shows trends of unstable weather. It has an 'issued' time stamp and a very wide 'valid' weather window (24 hours). The fronts are valid at a specific time, however (see above). The issued time is often 4.5 hours ahead of the valid times. This type of forecast graphic is very unreliable in the Tetons. Also, it doesn't tell you when forecast weather will arrive.
The next forecast map has a set valid time and is issued closer to that time. Obviously, it is not as reliable as a forecast just updated by the National Weather Service. It will be of greater value if you see the following map just after it was issued.
If the above map shows unstable weather but the one below suggests clear weather then you might want to check the forecast in more detail. Such a scenario might suggest high winds ahead of unstable weather at some point during the day or night.
For
the most part, our checks on summer weather are limited to the Lower Saddle's hourly forecast, the forecast discussions, and radar/satellite images if the weather looks promising. We also follow the weather leading up to a climb to get a feel for conditions. We also know how fast we can move and we're usually
alone. That helps with planning if bad weather is expected to arrive near a specific time of day.
We will pay more attention to the weather when traveling with others, or if we're expecting a real possibility of
encountering unstable weather or poor conditions due to the weather (falling temps).
~ SOMETIMES UNAVAILABLE OUTSIDE OF WINTER ~
During the 15 years prior to 2024, the average
first freeze date in the Town of Jackson was August 28. It's a little
sooner in the park.
Again, for some reason, the Driggs and JH airport weather stations often have trouble reporting precipitation data.
The precipitation graph's BLUE LINE sometimes lags behind the current
date if there hasn't
been any recent rain. We have seen both a flat blue line and no line for
the current time & day on these graphs. It's unknown if the
previous lags were processing errors or normal.
The JHA station is maintained by the FAA and not the NWS. According to our sources, the general feeling has been that the precipitation sensor at the airport weather station vastly under-reported rain and snowfall totals in the years prior to 2024. It was offline for extended periods in 2023, so maybe it got updated during one of their many remodels.
The JHA station is maintained by the FAA and not the NWS. According to our sources, the general feeling has been that the precipitation sensor at the airport weather station vastly under-reported rain and snowfall totals in the years prior to 2024. It was offline for extended periods in 2023, so maybe it got updated during one of their many remodels.
Precipitation @ 6430 ft
(11.5 miles west of Grand)
(11.5 miles west of Grand)
Precip during the last 31 days
Surprise Pinnacle Wind & Temp
Just east of Grand @ 9770 ft
Just east of Grand @ 9770 ft
(Winter Station)
Runoff or Precip + Low Temps = SNOW/ICE


 Lower Saddle Wind

14-day Temperatures Valley Floor 6450 ft
Current Pressure at the JH Airport (inHg)
During the peak climbing season, most stable high-pressure
systems over the northern Rockies provide excellent climbing weather. The calmest conditions and sunniest skies are found near the high pressure's center. If you're looking at weather graphics in the Northern Hemisphere, a high pressure system is a clockwise flow of sinking, dry air. It is often found behind a departing storm system. Just because a high pressure system is rolling over the Tetons doesn't
mean it's associated with nice weather. A quick rise in pressure can
indicate a short-lived high-pressure system with storms behind it.
Falling pressure is usually associated with the arrival of unstable weather during the summer. A sudden falling of the barometric pressure can denote high winds. See more here & See more here. High and low pressure systems don't have a set pressure value. They are relative to the pressure around them.
When valley air gains heat during the day and rises upslope (orographic lifting), that can create afternoon thunderstorms as the air cools and condenses. It's common.
A quick look at the Pacific Jet Stream on a Wind Map, or a look at the Pacific Surface Analysis Map, will give you some insight toward understanding surface analysis maps.
Vail Resort's JHGT Club by the airport
An extensive list of area webcams is here: SeeJH on YouTube
The Lower Saddle's weather station is usually offline outside of the peak climbing season (you will see the message: "No data Available"). The weather station is assembled around mid-June and taken down around mid-September. They tried leaving it running over the winter of 2018, but it stopped working sometime in October. The Bridger-Teton Avalanche Center has a list of weather stations that operate over the winter if you wish to track mountain weather.
LOWER SADDLE WEATHER DATA
~ SUMMER ONLY ~
Last 7 days. 11,600'
~ SUMMER ONLY ~
~ SUMMER ONLY ~
The accuracy of the temperature reading is unknown: +/- 1°F? The
summit of the Grand Teton at 13,775 ft can be 12°F colder but that is not
always the case.

Last two months or so
~ SUMMER ONLY ~
~ SUMMER ONLY ~
Speeds, Gusts, and Direction (coming from)
~ SUMMER ONLY ~
Speeds and Gusts over the last month or so
~ SUMMER ONLY ~
~ SUMMER ONLY ~
~~~~~~~~~~~
↓MountainWeather.com↓
We have followed meteorologist Jim 'Woody' Woodmencey's forecasts
since he started his website and see no advantage to using his forecast. It's just
another tool in the box. We like his list of resources and the occasional blog posts about mountain weather. During the big Solar
Eclipse in 2017, (The Great American Eclipse), Woody was
unable to accurately forecast the weather (sunny & clear). He used to talk about massaging the weather data from the NWS to give us a better forecast but his forecast was just as unreliable, misleading, or useful as any other forecast. He no longer makes a personal forecast.
~~~~~~~~~~~~
↓Mountain-Forecast.com↓
This website provides a forecast for the summit. Accuracy is a coin flip. They're sometimes close to observed weather. Sometimes wildly off the mark like any forecast. Again, it's good to check a forecast from more than one source and often one that uses a different forecast model.
~~~~~~~~~~~
↓More Obs. & Forecasts↓


Another with Radar, MSL Pressure, and Surface Wind

Surface Analysis - Check time
dBZ values under 25 (blue & light green)
are common to see on the radar image with no resulting precipitation as we alluded to above.
~~~~~~~~~~~~
↓Jet Stream, Pressure, & Winds↓
Again: FORECAST
500mbars (near 18,000ft)
See Valid Time
Temperatures are shown in °C along the colored lines. Humidity in green. 500mbar heights—elevations where the pressure is 500mbars—are shown in decameters with grey values along the dark lines. High pressure systems rotate clockwise in the Northern Hemisphere. 500mbars is near the middle of the atmosphere (18,000 ft or so).
Many websites let you map the wind at various pressures/elevations. The Windy
website is an impressive resource. The earth.nullschool.net website provides an animation of current winds at 500mbars over the Tetons (click on the word "earth" to see a menu for selecting different options). One other website that we will mention (there are many) is the University of Wyoming's: UW's Jet Stream Maps.
↓More Forecast Graphics↓
Check the issue time

Tomorrow's Forecast - General trends for Tetons but unreliable.
~ Longer Outlook ~


~ The Precip Forecast ~
NWS defined terms: Rain: (Stratiform) Precipitation, in general, is relatively continuous and uniform in intensity. Sky condition usually changes little throughout the day. Showers: (Convective) Precipitation
will be characterized by the suddenness in which it starts and stops as
well as by rapid changes in intensity. The sky may rapidly change in
appearance with peeks of blue and sun alternating with times of complete
overcast.

Probability of precipitation (POP)
The word "isolated"
in the NWS forecast refers to showers that are few and far between,
only 10% to 20% of the forecast area will receive measurable
precipitation. "Scattered" refers to the range of 30% to 50% coverage.
Neither refers to intensity, amount, or time. The NWS does forecast a
precipitation quantity in the hourly forecast graph; and, if you run your mouse over a graph you will see hourly percentages at the bottom of the graphics.
~ Thunderstorms ~
Sunny dry days are fairly common in the Tetons but so are afternoon
thunderstorm which usually arrive between mid-afternoon and early
evening (2 p.m. to 7 p.m.). If the forecast discussion mentions monsoonal moisture, low pressure, or a cold front
then that should raise a red flag. Those conditions can produce very
unstable and dangerous weather. If it starts to hail in the mountains,
thunderstorms are about to bust loose. Speaking of hail... it hurts.
It's another good reason for using a helmet.
The summit block is a lightning rod
Keep in mind that gullies can become the path of rushing water & tumbling rocks.
There are no safe places if you are outside in a thunderstorm. What follows is some general advice...
Don't group together during a storm. Ideally, stay 50-100' apart; at least 15'. Spreading everyone out may allow someone to escape injury and help others. Remove all metal from your body - jewelry, biners, glasses, etc. Metal can increase the severity of burns. Ropes can conduct electricity so there's a trade off between the fall-protection that the rope provides and the danger of it becoming a conductor that could harm you. Climbers can get burned from ground currents everywhere they are touching rock so don't lie down.
The temptation to avoid hail and rain may drive you to caves or overhangs but they can increase your odds of getting zapped especially near openings and low overhanging rock. Don't use a "space blanket!"
Even though most people survive a lightning strike, over 70% have permanent disabilities. The forces are similar to an IED blast and peak temperatures can reach 50,000°F. With or without lightning, climbing in the rain is a bad idea. Besides being slick, that water can turn to ice.
Even though most people survive a lightning strike, over 70% have permanent disabilities. The forces are similar to an IED blast and peak temperatures can reach 50,000°F. With or without lightning, climbing in the rain is a bad idea. Besides being slick, that water can turn to ice.
~ Historical Weather Patterns ~
The High Plains Regional Climate Center has nice tools for looking back in time at the weather. US Drought Monitor & Drought.gov
Historical Weather 1958-2012 GTNP (not Jackson)
 Moose, Wyoming from 1958 to 2016

As you can see from this data above, precip can vary wildly from year to year, month to month. The averages can be deceiving. WeatherSpark has a great weather page with graphics for all types of weather in Jackson Hole for a single month or all months of the year.


Lower Saddle Temperatures Summer 2016 - 11,600'

The hottest day of the year is, on average, July 16, with a high of 79°F and a low of 48°F at the valley floor.
Lower Saddle Temperatures Summer 2017 - 11,600'
The hottest day of the year is, on average, July 16, with a high of 79°F and a low of 48°F at the valley floor.
Lower Saddle Temperatures 2019 - 11,6009
Climbers
have been killed by wind gusts while on the Grand
Teton. Wind-chill temperatures are often the bigger threat.
Lower Saddle Wind Speeds Summer 2016 - 11,600'

Lower Saddle Wind Speeds Summer 2017 - 11,600'
 Lower Saddle Wind Speeds 2018 - 11,600'
Lower Saddle Wind Speeds 2019 - 11,600'
The Lower Saddle's wind speeds usually die down to a more manageable level once you get a little ways above the saddle. Higher wind speeds can
reappear at the Upper Saddle but it is unlikely that you will find the
same rocket-ship wind speeds that one finds at the Lower Saddle unless it's just one of the days.
Weather during the summer of 2019
We
can have dry summers or nasty wet ones but they are usually a mix
favoring more sun than rain in Jackson Hole. A typical summer provides
many exceptional days for climbing. If it does rain, it's usually in the
afternoon. Most climbers try to summit before noon.
Plenty of climbers make later summits including us. Our summit times
vary with the weather outlook, mountain conditions, and our preferences
for warmth, solitude, sleep, etc.
Between
June and September, summit temperatures can swing from the single
digits to the 60's. Temperatures in the 20's and 30's are possible when
people are climbing in the early morning. During the hottest part of the
summer, you will find shaded morning temperatures in the 40's. Those
temperatures can change very quickly as a cold front, bad weather or
darkness moves over the area. Be cognizant of the direction that
temperatures are moving under wet conditions. Moisture can quickly freeze to rock and make it impossible to safely
navigate the mountain if you are soloing under falling temperatures. And that moisture can come from a passing cloud's vapor, not precipitation.
~ Weather Contacts ~
GTNP Weather Line: 307.739.3611
National Weather
Service - Riverton
Western and Central
Wyoming
nws.riverton@noaa.gov (weather)
nws.riverton@noaa.gov (weather)
1-800-211-1448
12744 West U.S. Hwy 26
Riverton, WY 82501
307-857-3898
12744 West U.S. Hwy 26
Riverton, WY 82501
307-857-3898
~ Typical Temperature Differences ~
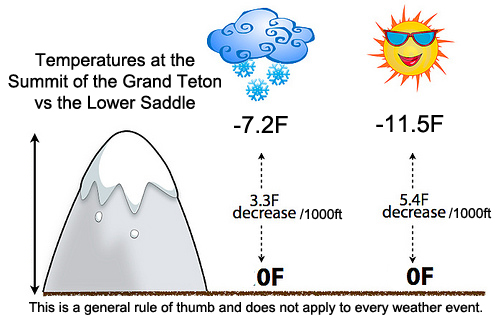
The above graphic illustrating the lapse rate is used to estimate the
worst-case scenario for falling temperatures while climbing. The
atmosphere can include both dry and moist adiabatic conditions at the
same time. For example, moist clouds can sit above hot dry air. And the
moist lapse rate (3.3 °F/1,000 ft) can vary while the dry lapse rate is
pretty constant (5.4 °F per 1,000 ft). There are obvious exceptions to
our lapse rate calculations. Inversions
are one example. They happen when heavy dense cold air gets trapped
under the less dense hot air. Temperature inversions can have a
40°F spread between the valley floor and upper elevations during the winter.
Summer inversions are typically limited to overnight or early-morning
hours and they rarely have large temperature spreads like the winter ones (see below...).

Summer inversions on the majority of 2025 mornings
The worst-case temperature difference
under clear skies between the Lower Saddle and the summit should be near 12°F.
We don't know how accurate the Saddle's temperature readings are, nor a
exact lapse rate, so give yourselves some wiggle room on the
worst-case scenario.
A little history factoid: The NWS out of Riverton, WY, used to provide a custom recreational forecast for the Grand Teton's summit and the Lower Saddle starting back in 2011. It wasn't very accurate. Had they taken into account the Lower Saddle's weather station data and adjusted their model, they might have had a more reliable forecast. Apparently, the only mid to upper level weather station that the NWS utilizes in modeling Teton weather is the one atop Teton Pass. They still issue a zone forecast for the Gros Ventre & Teton mountains.
An average of 8°F was the difference used by the National Weather Service back when they provided a forecast for both the summit and the Lower Saddle. That never changed even if the weather did.

The accuracy note at the bottom was added by us. The overnight forecast for the Lower Saddle had 39°F but the weather station recorded 32°F. The Old NWS forecast for the Summit and Lower Saddle always had an 8° difference between both locations.
As the graphic above clearly illustrates, the time of day can influence the temperature difference between two different elevations. And temperature swings at the Lower Saddle are fairly minor compared to those at the valley floor during the summer.
It
should be obvious that the temperature difference between two
different elevations depends upon several factors besides the amount of
moisture in the air. Also, inversions can happen in highly localized
and unexpected ways. We have found new ice at the Lower Saddle when overnight temperatures seemed too warm for new ice to develop, or stick around.
According to many sources, on a clear and calm night, the temperatures close to the ground can easily be 3 to 5 degrees cooler (or more) than just 2 meters above. The typical weather station thermometer is 2m above the ground. Also, rocky surfaces can cool more rapidly due to radiational cooling. That cold rock might keep ice from melting, or assist in ice/frost formation. The saddle's weather station is positioned along the western side of the saddle where air rises from the valley below. That air by the weather station might be warmer compared to other locations around the saddle.
According to many sources, on a clear and calm night, the temperatures close to the ground can easily be 3 to 5 degrees cooler (or more) than just 2 meters above. The typical weather station thermometer is 2m above the ground. Also, rocky surfaces can cool more rapidly due to radiational cooling. That cold rock might keep ice from melting, or assist in ice/frost formation. The saddle's weather station is positioned along the western side of the saddle where air rises from the valley below. That air by the weather station might be warmer compared to other locations around the saddle.
The Catwalk - Mid-afternoon August 9th, 2015.
In
July of 1993, 6 feet of snow fell at the Lower Saddle (11,600') and it
was the coldest & wettest summer on record in Jackson.
You'll have about 16 hours of daylight during the 2nd-to-last week in June when the summer solstice arrives in GTNP. The days get shorter as we roll through summer.
You'll find more snow at the lower elevations in the month of June compared to September; however, the June days are longer and warmer. June usually gets more thunderstorms but September's storms typically bring snow and ice that sticks around due to shorter days, lower temps and changing sun angles. These two months are considered part of the shoulder season for climbing in GTNP.
You'll find more snow at the lower elevations in the month of June compared to September; however, the June days are longer and warmer. June usually gets more thunderstorms but September's storms typically bring snow and ice that sticks around due to shorter days, lower temps and changing sun angles. These two months are considered part of the shoulder season for climbing in GTNP.
~ Atmospheric Pressure & Altitude ~
The atmospheric pressure
atop the Grand has slightly more than half the atmospheric pressure
found at sea level: 0.58 atm (at 40°F) vs 1.0 atm found at sea level. It
is common to find 600hPa of pressure near the elevation of the Grand.
That is about .59atm, 8.7psi, and 17.7inHg. Many atmospheric maps show a specific pressure value. A jet stream map close to
500hPa (500mb) is usually associated with atmospheric pressure
near 18,000 ft. 300hPa is near 30K ft. You can see the different wind patterns at various elevations play out on animated wind maps by changing the target atmospheric pressure, or change the forecast model used (more here).
~ Hypothermia ~
Climbers can experience hypothermia & frostbite
during the summer. Wet clothes lose much of their insulating properties
and a breeze can greatly increase the rate of heat loss so hypothermia
can happen in air temperatures up to 50°F. Mild hypothermia can increase
the odds of an accident due to the loss of dexterity, mental focus, and
other factors. Forget hypothermia, just being cold is uncomfortable and
can result in a loss of focus and dexterity.
The cold can be deadly. Hypothermia took the lives of three Grand Teton climbers in 1985 after a snowstorm caught five climbers on the Exum Ridge, and hypothermia ultimately took the life of Gary Miller in 2013. Other cold-related injuries such as frostbite can be present either alone or in combination with hypothermia.

If you're unprepared for a cold windy day
on the Grand Teton, you're likely to turn around after a whole lot of
effort & time on the approach.
The wind chill index probably contains assumptions about the human body type, clothing, amount of physical activity, sunlight and ultraviolet radiation exposure, and the wind speed so don't expect a perfect model of perceived temperatures.
The cold can be deadly. Hypothermia took the lives of three Grand Teton climbers in 1985 after a snowstorm caught five climbers on the Exum Ridge, and hypothermia ultimately took the life of Gary Miller in 2013. Other cold-related injuries such as frostbite can be present either alone or in combination with hypothermia.
The wind chill index probably contains assumptions about the human body type, clothing, amount of physical activity, sunlight and ultraviolet radiation exposure, and the wind speed so don't expect a perfect model of perceived temperatures.
~ The Sky ~
The sun sets far in the northwest during June's summer solstice
and burns the Owen-Spalding route clean, or tries to. It also reaches
its maximum height in the sky during the solstice. Near the fall & spring equinox,
the sun sets almost directly in the west and the route burns off
slowly. During the winter the Owen-Spalding route gets very little
direct sunshine. And the floor of Garnet Canyon doesn't see too much sun
during the winter because the sun is low in the southern sky for most
of the day which means it's behind Nez Perce,
etc. The winter sun also sets in the southwest. The Upper Exum rises
above 12,000' and faces south so it gets the winter sun's warmth.
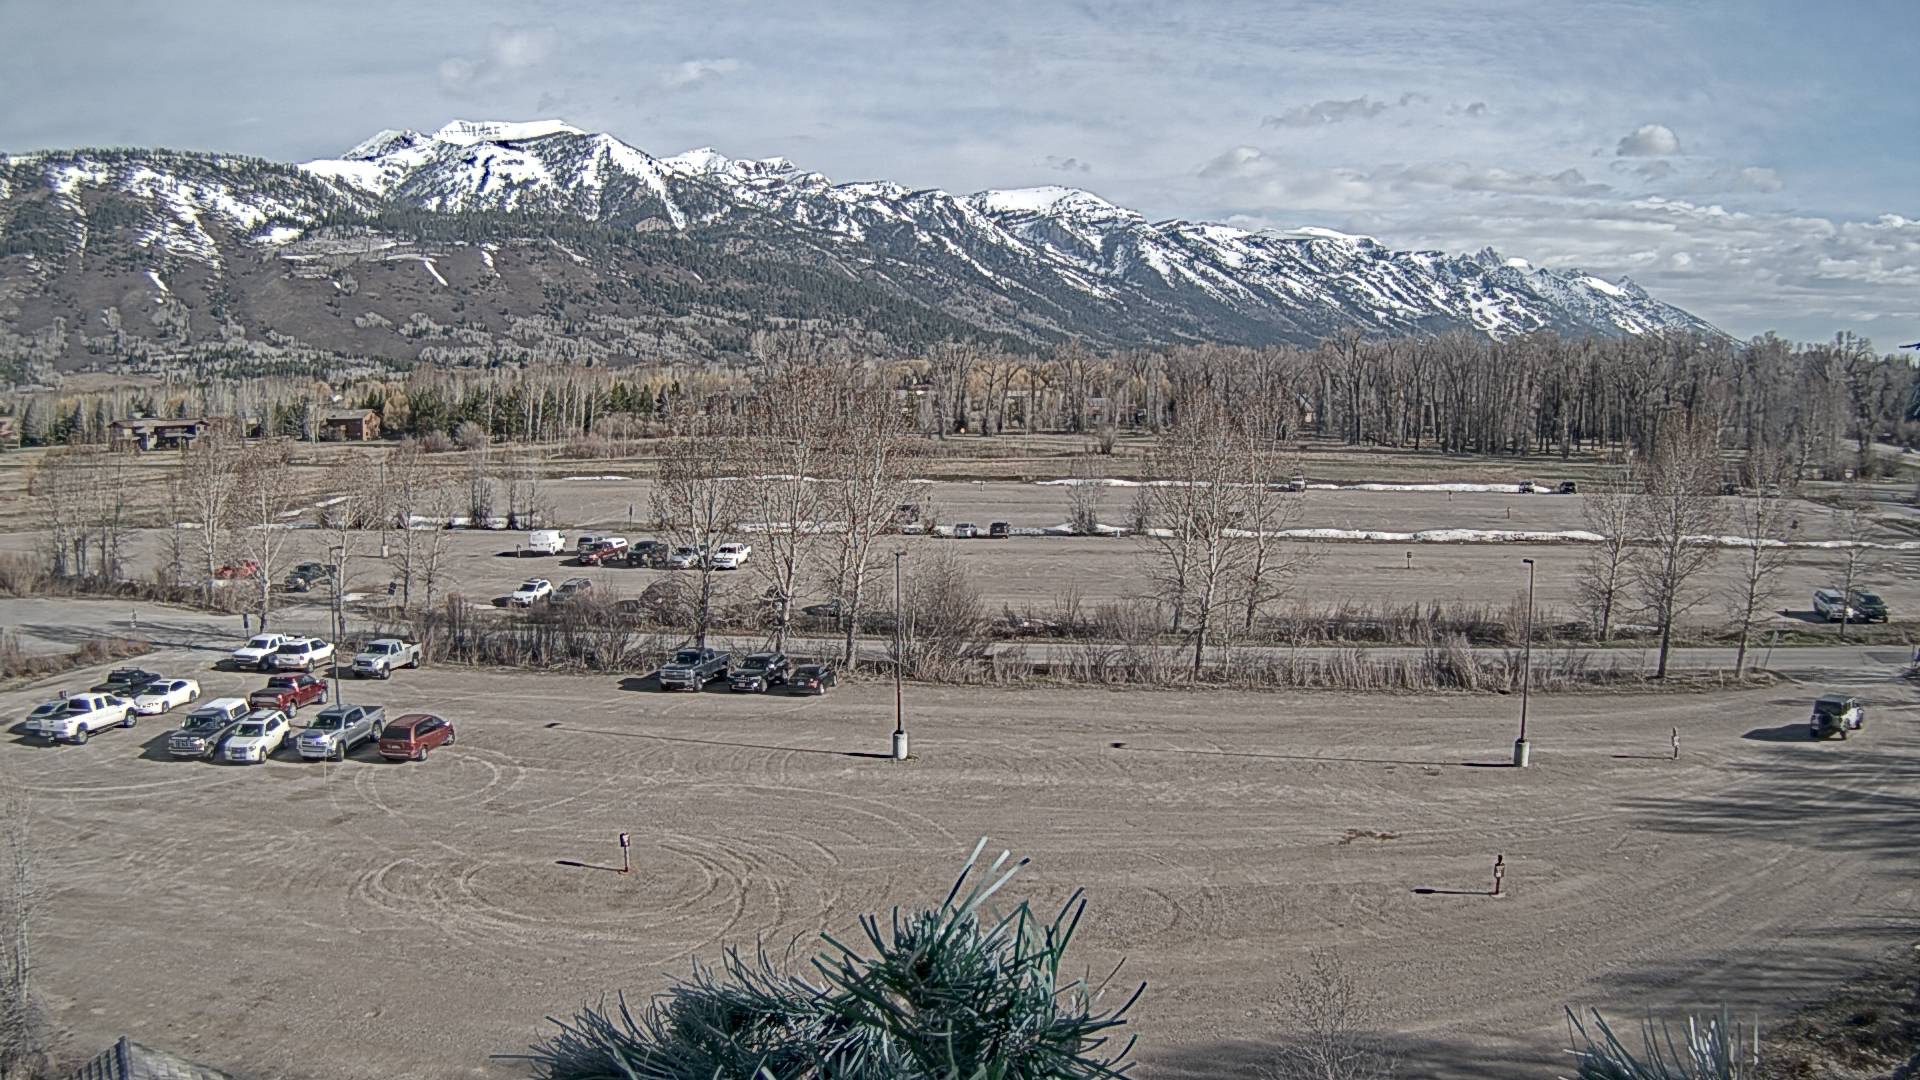
~ Grand Teton Webcams ~
If an image is dark, the webcam may be having issues or it may be
nighttime. Sometimes the live stream is working but the still image is
not being captured.
Live Streaming on YouTube - SeeJH
Overview - Upper Exum
Overview - Owen-Spalding
The Approach & Other Details
A few trip reports for
April through October
April through October
July 17th, 2016 (UXM) PNG Variation
~~~~~~~~~~~~~
Route Details
Overview - Owen-Spalding
The Approach & Other Details
↓Other Forecasts, Obs, etc↓
We haven't really organized this last list of resources. Many of the links no longer work. We just keep dumping links here as a holding bin until we decide their worth to us. Some are duplicates. Workin' on it.
WU's Forecast for JH
NWS
National Radar & Forecast
Experimental Weather Map of the USA
Clickable Greater Yellowstone Forecast Map Forecast Fronts/Pressures/Weather Map
Regional Snow Analyses: Central RockiesThe USDA Interactive Map
has a snow depth feature. Choose that "Snow Depth" option from linked page. You will be taken to the online map. The Map
Controls dialog box should show that "Snow Depth" has been selected. Click on a station shown on the map. The interactive map will
return a popup box with the value for the snow depth. You can click on the Data Reports icon to see more info.
Togwotee Pass usually sees its snowiest month in April (avg 46")
due to its location. The Grand - just east of Targhee - can get far more
snow than anywhere else but it tends to shed off aspects. The Surprise Meadow's winter weather station is just to the east of the Grand and it collects snow depth information near 9600'. Buckrail has a nice overview of winter weather patterns.
Weather Underground's Calendar View shows past precip during the current month (most likely at the airport). The Jackson Hole Airport weather station has rainfall totals for the last 3 days. And/or here.
↓MesoWest Observations↓
MesoWest Stations At Upper Elevations
(some are only available during the winter or summer)
(summer only)
(winter only)
(winter only)
↓Winter Observations↓
Snake River Station Snow Forecast (Interactive NOAA Map)
NWS Online School for Weather
NWS Jackson Weather Radio: 162.525
NWS Grant Village Yellowstone: 162.450
NWS Driggs ID: 162.450
NWS Jackson Weather Radio: 162.525
NWS Grant Village Yellowstone: 162.450
NWS Driggs ID: 162.450
R. Bowl Snowfall JHMR 9580 ft
Grand Targhee Snowfall
Weather Station East of Grand Teton
Valley Snowfall Graphs
Grand Targhee Snowfall
Weather Station East of Grand Teton
Valley Snowfall Graphs
JHMR Weather & Snow Report
JHMR Grooming Map
JHMR Summer Trail Map
Snow King Snow Report
Targhee Snow Report
JH P&R XC Grooming Report
JH Ski Club
JH Snow Devils
TetonAT.com
JH P&R Ice Rinks
Snow King Ice Rink
Powder Project
Backcountry Recon
Friends of Pathways Nordic & Pathway Maps
Snowmobile Maps
JH Ski Atlas
JH BC Skiing Books
~~~~~~~~
Overview - Upper Exum
Overview - Owen-Spalding
The Approach to the Lower Saddle
Wyoming Whiskey Home Page
~~~~~~~~~~~~~~~~~~~~~~~~~~